

Leader LC2566 BLANK PANEL

Sună pentru preț
Adaugă la favorite
Adaugă la favorite
Ți-a plăcut acest produs? Adaugă-l acum la favorite.
Adaugă la favorite
Adaugă la favorite
Description
The LC2566 is a blank panel for the LR2561 rack mount adapter.
Use it when installing a single LV5600 waveform monitor in the LR2561.
Produse similare


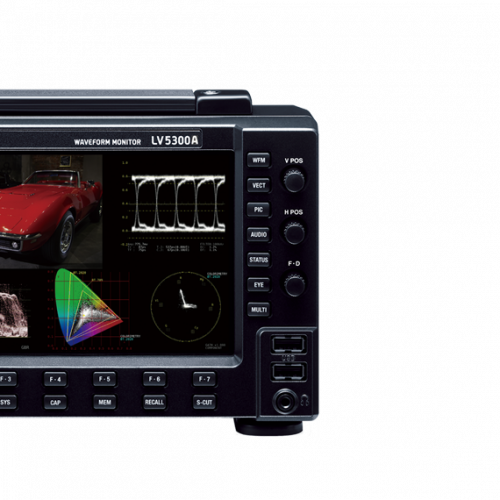
Leader LV5300A WAVEFORM MONITOR
In Stock

Leader LC 2183 LTC CABLE
In Stock

Leader LR 2490 RACKMOUNT ADAPTER
In Stock
Reviews
There are no reviews yet.